livellosegreto.it is one of the many independent Mastodon servers you can use to participate in the fediverse.
Livello Segreto è il social etico che ha rispetto di te e del tuo tempo.

Administered by:

Server stats:

1.2K
active users

#datascienceeducation

0 posts0 participants0 posts today

It’s important, when you’re making graphs, to think about the story you want to tell with the data, and what type of graph, and what features of the graph, will help you tell that story.

Likewise, when you’re looking at someone else’s graph, we all need to apply that critical data literacy and look at the scale on the y axis, as well as checking the labels, finding out the origin of the data, and considering whether the graph is accurate, a valid way to display that data, and what story it might be trying to tell you.

https://adsei.org/2025/04/10/scaling-scams/

If you're looking to master Deep Learning, following a structured roadmap is key to navigating this advanced and ever-evolving field.

I came across this roadmap on the AIGENTS website, and what really stands out is its interactive format. Each element is clickable, offering AI-powered insights and resources that make it easier to dive deeper into each topic. Check out this link for more details: aigents.co/learn/roadmaps/deep

What we can build this way is a world where policy is evidence based. Where we make data informed decisions, while understanding that the data isn’t perfect. Where kids are empowered to learn all of the skills they need to solve problems in their own communities. Where technological solutions are rationally evaluated, rather than uncritically worshipped. 

https://adsei.org/2024/11/23/from-hypnotised-to-heretic-immunising-society-against-misinformation/

ANOVA can be used to test whether there are differences among group means, but it doesn't tell you which specific groups differ from each other. That's where Tukey's HSD test comes in—it helps pinpoint exactly which group means are significantly different.

For more on Tukey's HSD and other statistical methods, join my online course on Statistical Methods in R.

More details are available at this link: statisticsglobe.com/online-cou

Did you know that China and India together account for over a third of the world's population? 🇨🇳🇮🇳 
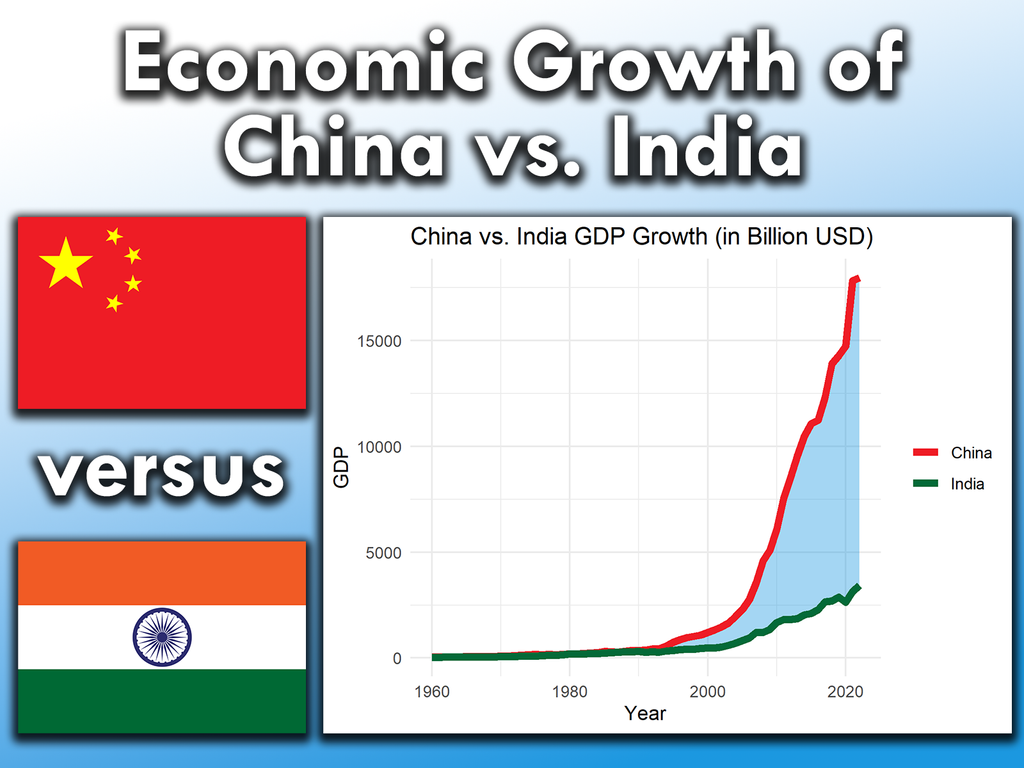
Their rapidly growing economies are transforming the global economic landscape.

Both countries face unique challenges but have the potential for continued economic growth.

I have created an extensive article on this topic for those who want to dive deeper into the GDP comparison between China and India. More details: statisticsglobe.com/gdp-china-

Folium is a powerful Python library that lets you create stunning interactive maps using Leaflet.js. It's a fantastic tool for visualizing geographic data in a dynamic way.

With Folium, you can transform your data into beautiful maps with minimal effort, making it perfect for data analysts, geographers, and anyone interested in geographic visualizations.

More details are available at this link: eepurl.com/gH6myT